
Reality: Water quality is actually deteriorating in many places, particularly in lowland pastoral and urban areas.
The Ministry for the Environment (MfE) made an announcement in 2013 that for the last ten years water quality was stable or had improved at most monitored sites (see Figure 1 below). The data they used was from more than 300 sites around New Zealand collected by regional councils and added to the 77 National Water Quality Monitoring Network (NWRSQN) sites. [1]

Figure 1: Screen capture from the Ministry for the Environment web page claiming that water quality is either stable or improving at most monitored sites. This is incorrect; the grey areas of the bars are the sites that do not have statistically significant trends. This situation is not “stable” as there is a test for stability and less than 10 per cent of sites have met this criterion. (Graphic from Ministry for the Environment)
This statement has made no sense to many freshwater scientists in New Zealand, as it flew in the face of all the research being done by independent researchers. Closer inspection revealed that MfE had used the word ‘stable’ for sites that did not have a statistically significant trend either up or down (i.e. the time period chosen (ten years) was not long enough to determine if there was a trend or there was not enough data to show a trend). Most of these sites are, in fact, showing declines in water quality but there are simply not enough data points over ten years to make them statistically significant. By labelling these non-significant sites ‘stable’, it was assumed that they had not declined in quality. This is not the case; it is just that by choosing a short time period the number of data points reduced, making statistical significance less likely.
Importantly, there is in fact a test for a ‘stable’ trend, and when this is applied, less than ten percent of the sites were stable.
In fact, most sites have worsened over 20 years or show little sign of improvement, apart from phosphate but this is reducing at twice as many natural sites (those with no development in catchment) than it is in pasture catchment sites. The following graph (Figure 2) show trends over time for four water-quality measures in the regional council database which includes over 300 sites nationwide.

Figure 2: Trends in total phosphorus, dissolved reactive phosphorus (DRP), E. coli and total nitrogen for Regional Council data over a period between 7 and 22 years.
Looking at the trends over time at the large regional council database of sites (more than 300 sites are used for MfE analysis), it is clear that nitrogen in rivers has been increasing over the last 24 years that records have been kept and the levels at sites in pasture catchments far exceed the levels at sites in native vegetation (Figure 3).

Figure 3: This plot shows the proportion of samples from approximately 300 sites from around the country sampled by regional councils that exceed the ANZECC total nitrogen guidelines of 0.61 mg N/L for the two main land-cover classes – native vegetation and pasture.
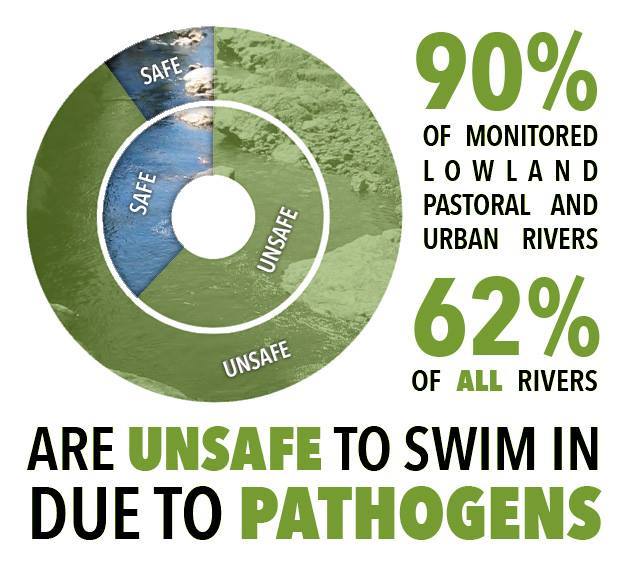
Additionally, pathogens from town sewerage and animal excrement can also cause problems in freshwater. Farm animals are probably the worse culprits for pathogens, especially if they have direct access to streams and rivers. While many rivers are being fenced off from animals, small streams are generally not, and these flow into larger streams and rivers. Furthermore, pathogens on the land often wash off into streams and rivers during rainfall. Planted riparian zones (strips on either side of streams, rivers and lakes) can intercept some pathogens running off the land but research has shown that pathogens can still reach waterways through the plantings.
 The population of dairy cows in New Zealand excrete faecal pathogens equivalent to over 90 million humans [2]. Sheep and beef cattle also contribute large amounts. These pathogens can end up in freshwater and exceed concentrations safe for humans to swim in or drink, causing waterborne diseases. New Zealand has among the highest frequencies of waterborne diseases per capita in the OECD [3]. Instead of doing something about this, the government have lowered water standards to be adequate for secondary contact (non-contact recreation) – allowing most of our rivers to become unswimmable. Read more about the recent changes to freshwater standards here.
References:
[1] National River Water Quality Network (NRWQN), NIWA. Find out about the NRWQN here.
[2] Environment Waikato. (2008). The condition of rural water and soil in the Waikato region: Risks and opportunities. Hamilton, New Zealand.
[3] OECD (2007) OECD Environment Performance Reviews: New Zealand. Organisation for Economic Co-operation and Development.
