Reality: These changes will most likely degrade water even further, as they allow more pollution than previous limits.
In 2011, a National Policy Statement (NPS) on freshwater [1] in New Zealand was enacted, and in 2013/14 the supporting National Objectives Framework (NOF) [2] was implemented. This framework gives limits and numbers to achieve the goals of the NPS.
The NPS has ambitious sounding expectations for “maintaining or improving freshwater quality” but, crucially, the numbers and limits in the NOF just don’t match up with these aspirations Rather they allow for much worsening. Worse still, most of the parameters used in the past to measure the health of fresh waters are not included in the NOF [3].
As an example of the weakening of standards was the inclusion of only one nutrient in the NOF (nitrate). Furthermore, the new limits for nitrates are a tenfold weakening of previous limits, going from the ANZECC [4] guideline level of 0.61mg/l to the new bottom line of 6.9 mg/l. The quality bands (A, B & C) for water quality were set so that less than one per cent of the rivers in New Zealand would breach the bottom line and most would score an A [5] (Figure 1).
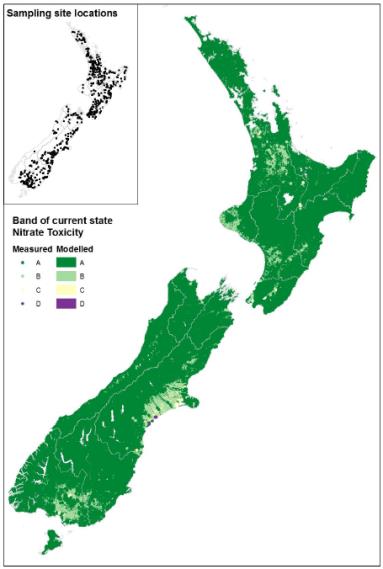
Figure 1: This map shows New Zealand rivers in different nitrate bands. (From Unwin, M. J. & Larned, S. T. (2013). Statistical models, indicators and trend analyses for reporting national-scale river water quality. (NEMAR Phase 3) (NIWA))
To give some idea of just how much ground was given here, comparison with other countries shows that some of the most nutrient-polluted rivers in the world like the Yangtze in China, and Mississippi in the USA, would score a B under this new ranking (Figure 2).
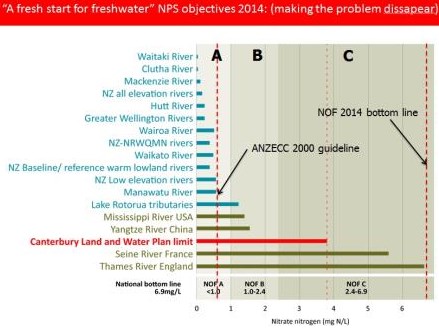
Figure 2: This graph compares the median levels of nitrate nitrogen from a range of rivers in New Zealand and overseas. The three bands shown are from the National Objectives Framework 2014. The ANZECC guideline trigger level for nitrate nitrogen (0.61 mg/l) is shown as a dotted line.
The map of nitrate levels in Figure 3 reveals that many of New Zealand’s rivers already exceed the ANZECC nitrate guideline limits, and that this weakening in the NPS was a purely political response, shifting the goalposts to suit the present situation.

Figure 3: Modelled current- state nitrate nitrogen for New Zealand rivers. The ANZECC guideline value is 440 so all rivers coloured dark orange or red exceed guidelines for triggering nuisance algal growth. (From Unwin, M. J. & Larned, S. T. (2013). Statistical models, indicators and trend analyses for reporting national-scale river water quality) (NEMAR Phase 3). NIWA.)
As well as weakening limits, the NOF also omits most of the waterway health assessment tools regularly used, such as oxygen variability, temperature extremes, deposited sediment, and crucially, any of the well-developed biomonitoring tools such as the Macroinvertebrate Community Index. The other obvious omissions are any assessment of the health of groundwater and estuaries and notably the omission of benthic cyano-bacteria: the stuff that kills dogs and may kill children.
The Ministry of Health Contact Recreation limit was dropped and replaced by a new level called ‘secondary contact’. Once more, this is a massive weakening of protection. The new limit is to protect people in boats or waders, not people swimming!
Figure 4 shows that the new limits (secondary contact) mean that most of New Zealand’s waterways score an A or B. Contrast this with the fact that 62 percent of all New Zealand rivers exceed the Ministry’s health limit of 260 E. coli/ml – the limit at which water is safe for swimming. This is another stark example of shifting the goalposts to accommodate the current situation and give head-room for further agricultural intensification.
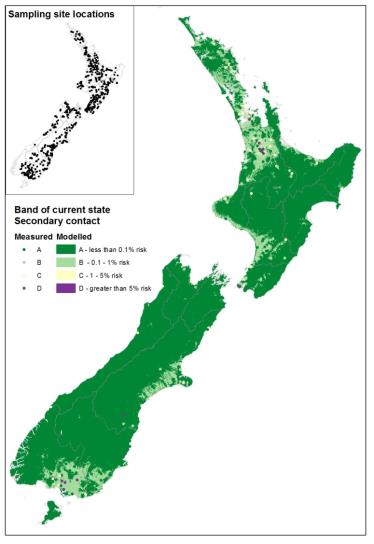
Figure 4: Bands for the new National Objectives Framework for freshwater secondary contact. (From Unwin, M. J. & Larned, S. T. (2013). Statistical models, indicators and trend analyses for reporting national-scale river water quality) (NEMAR Phase 3). NIWA.)
More applicable standards that will manage freshwater to ecological standards will improve freshwater, not lower standards to fit the situation.
References:
[1] National Policy Statement for Freshwater Management, Ministry for the Environment. Read the NPS here.
[2] Freshwater reform 2013 and beyond. Retrieved from here.
[3] Science Media Centre (2014). Freshwater national standards set – experts respond. Read their responses here.
[4] Australian and New Zealand Environment and Conservation Council (2000). Australian and New Zealand guidelines for fresh and marine water quality: Volume 1 – The guidelines. Read the guidelines here
[5] Unwin, M. J., & Larned, S. T. (2013). Statistical models, indicators and trend analyses for reporting national-scale river water quality, (NEMAR Phase 3) NIWA.
