
The environmental impacts of a meat-based diet.
It is well recognised that humans have a substantial impact on the environment, with some activities and land use being more harmful than others. Humanity’s consumption of resources and the way land is managed has a huge role in the deterioration of the environment.
Food production is linked to a substantial array of environmental and social harms and benefits. One response to these impacts that is being increasingly discussed is eating less meat. However, unlike the multitude of other actions paraded about to solve problems of climate change, water scarcity, energy use and pollution, our diet is out-of-bounds for discussion on reducing environmental harms. Changing our diet for reasons other than personal tends, ironically, to be a sensitive topic.
So what are the differences between vegetarians, vegans, and plant-based diets? While vegetarians do not eat meat, fish, or poultry, vegans in addition do not use other animal products and by-products, such as eggs, dairy products, honey, leather, fur, silk, wool, velvet, cosmetics, and soaps derived from animal products. A plant-based diet excludes meat, poultry, fish, dairy products, and eggs, but may include consumption of other animal products not included in the diet. Of course, there are also variations in omnivore diets, which will have varying impacts.
Food is culturally and socially ingrained in our lives, so it is no surprise that this is a difficult practice to change and one that we fiercely defend. A team of researchers found that the vast majority of omnivores defend eating meat under four false rationalizations (4Ns) – the belief that eating meat is natural, normal, necessary, and nice – each of which help individuals justify actions that are increasingly coming under public scrutiny [1].
There is overwhelming evidence that animal agriculture in particular causes substantial and disproportionate environmental impacts. Eliminating animal products will reduce ones individual environmental and carbon footprint. The production of animal products is inefficient in terms of land, water and energy use, and is more damaging from a biodiversity, climate change and animal welfare point of view than producing plant based products [2].
Here, we explore the inefficiencies in producing meat products and, where possible, compare with plant based products.
Sections:
– Increasing global consumption of meat
– Environmental impacts of animal agriculture
– Land use, feed, and efficiency
– Water
Coming soon:
– Energy/Greenhouse gas emissions
– Pollution/environmental degradation/waste
– Biodiversity loss/deforestation
Increasing global consumption of meat
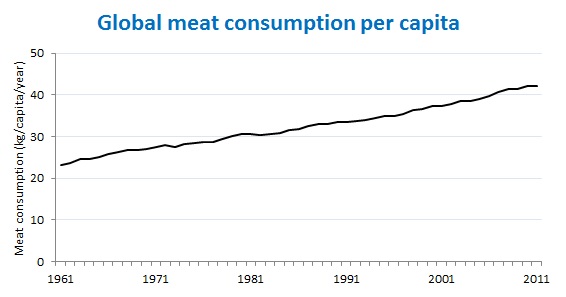
Figure 1: Global meat consumption per capita from 1961 to 2011. (Data source: FAO Statistics Division, 2013) [3].
Global meat production has risen almost six fold in 60 years from 50 million tonnes (Mt) in 1950 to 275 Mt in 2010 [2]. The average global meat consumption is around 40 kilograms (kg) per person per year, double what it was in 1960 (Figure 1) [3]. In 2009, among the highest consumers of meat were the United States (120.2 kg/capita), Australia (111.5 kg/capita) and New Zealand (106.4 kg/capita) (Figure 2). This is astounding compared to those at the bottom, India with 4.4 kg/capita and Bangladesh with 4 kg/capita [4].

Figure 2: Meat consumption per capita in 2009. (Source: ChartsBin, 2013) [4].
Environmental impacts of animal agriculture
According to Smil [2] “mass-scale meat production is one of the most environmentally burdensome activities” (pg. 67). Impacts range from water contamination, soil erosion, and global atmospheric changes from greenhouse gas (GHG) emissions. Increases in meat production have required a large-scale shift from diversified farmland and rainforests to “monocultures of animal feed”. Moreover, Smil argues it is hugely inefficient to feed edible grains to farm animals, instead of eating them ourselves.
There are huge variations globally in livestock production systems, management practices, resource-use efficiency, and mitigation potentials [5]. Solutions therefore, will generally be local and highly situation-specific. There is a substantial lack of comparable data between food production systems in New Zealand, as well as between countries. Some forms of animal production will have lower environmental impacts in New Zealand, while others may be worse.
Land use, feed, and efficiency

Livestock farming requires a large amount of land. Livestock production, including land to grow feed crops and graze animals, covers 30 per cent of the ice-free land surface of the planet, and 70 per cent of all agricultural land [6]. Thirty-three per cent of the global arable land is used to feed animals [6].
In the United States, animal based agriculture uses around 40 per cent of all U.S. cropland for feed production. Including pasture, animal agriculture uses 40 per cent of the total land area of the U.S [7]. In New Zealand, nearly 40 per cent of land was covered in exotic grassland in 2012, primarily for pastoral agriculture [8]. Beef eaters are estimated to use up to 160 times more land resources than plant based eaters [7].
Large variations exist between animal production types and regions. For instance, in the U.S., beef uses around 88 per cent of all land allocated to producing animal-based calories [7] but huge differences in grains or pasture are required to feed cows in different regions. For example in North American or Europe, a cow consumes about 75 kg to 300 kg of dry matter (grass or grain) to produce a kg of protein. However, in sub-Saharan Africa a cow might need 500 kg to 2,000 kg of dry matter to produce a kg of protein because of the poor feed quality and high mortality rates in herds of undernourished and sick animals [5]
In most cases, livestock farming requires more land and feed to produce the same amount of calories or protein than those provided by non-animal production methods. According to Penning de Vries and others an affluent diet containing animal products requires three times more food biomass per capita (about 1,530 kg per year/person) than a healthy, largely vegetarian diet (about 476 kg per year/person) (Figure 3) [9]. This is largely because of the feed required for livestock farming, which could instead be used to feed people. Globally, 77 million tonnes of human edible protein are fed to livestock, while 58 million tonnes of human edible animal protein is received back [6].

Figure 3: Kilograms of food biomass required for a healthy vegetarian diet and an affluent diet containing animal products [9].
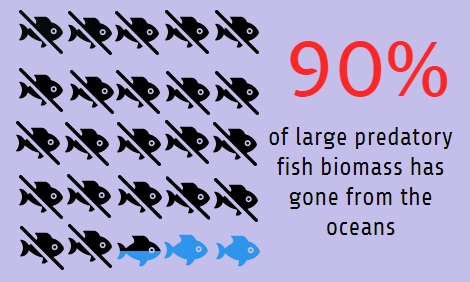
In 1990, the World Hunger Program calculated that the world harvest at that time could provide a vegetarian diet for 6 billion people, given no diversion of grain to feeding livestock, whereas a meat-rich diet could only support 2.6 billion people [10]. We are already into deficit consumption of land, largely made up by over-fishing the oceans. This is not sustainable; it has been estimated that large predatory fish biomass is only about 10 per cent of pre-industrial levels [11]. Farming fish, thought to be a solution to this problem, is not helping; the production of one kilogram of farmed fish flesh requires around five kilograms of wild caught fish [12].
 Since 1990 (the year the world harvest was based on), not only has the population increased but so has global meat consumption, so our resources are even more constrained to feed the entire population on a meat-based diet.
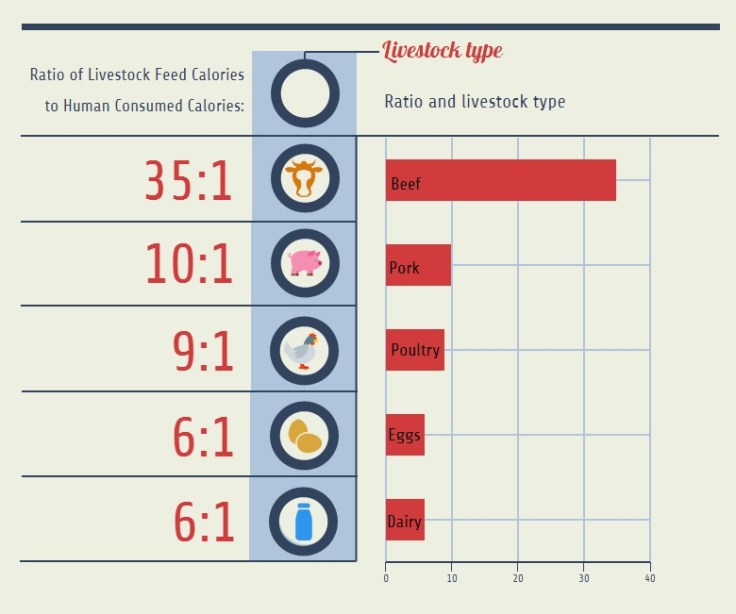
Some types of animal production are less efficient than others. A U.S based study found that beef was the least resource-efficient animal production method [7]. When comparing livestock feed calories with human consumed calories, beef came out the worst at 35:1, followed by pork (10:1), poultry (9:1), and eggs and dairy (6:1). Beef production also required more land and irrigation water, and produced more greenhouse gas emissions and nitrogen discharges than the other livestock categories. On the other hand, staple plant foods had lower impacts than all of the livestock categories.
What about soy?
Soy is largely considered as an alternative to meat based products, but it is not without its problems. However, the problems are mostly related to animal agriculture.
World soybean production has increased by over 500 per cent in the last 40 years [13] and soy bean meal accounts for 65 per cent of the world’s protein feed [14]. A huge amount of deforestation is caused by soybean production, primarily in South America [15]. In Brazil, approximately 18 per cent of the Amazon was deforested between 1970 and 2010, primarily for soybean cultivation and pasture expansion [16].
So where is all this soy going?
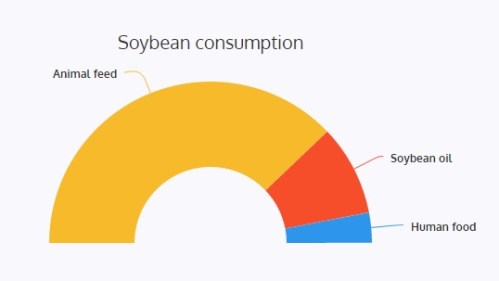
Figure 4: Proportion of global soybean consumption for different uses [15] [17].
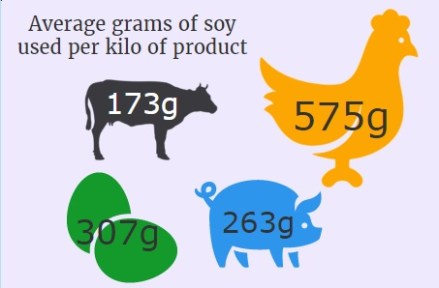
Although many vegetarian protein products are made of soy, most of the soy grown isn’t used to produce alternative meat products (Figure 4). Around 75 per cent of the world’s soy is fed directly to livestock [17]. Only six per cent is turned into human food and the rest is turned into soybean oil [15]. Europeans consume around 61 kg of soy per year/person, of which 93 per cent is in the form of animal feed [17]. In addition to other feeds, the production of one kilogram of chicken uses 575 grams of soy; likewise 263 grams of soy are used for one kilogram of pork, 173 for beef, and 307 for eggs [18].
Soybeans are a more efficient source of protein for humans than animal sources. Soybeans can produce at least twice as much protein than any other major vegetable or grain crop, 5 to 10 times more protein per acre than land for grazing animals to make milk, and up to 15 times more per acre than land for meat production [14].
Water
Agriculture uses around 70 per cent [19] to 80 per cent of all the freshwater globally [20], and nearly one-third of that is used for the production of animal products [21]. In the U.S., livestock production requires around 45 billion cubic metres (m3) of irrigation water (27% of the total national irrigation water), which is comparable to household consumption of water in the U.S. [7].
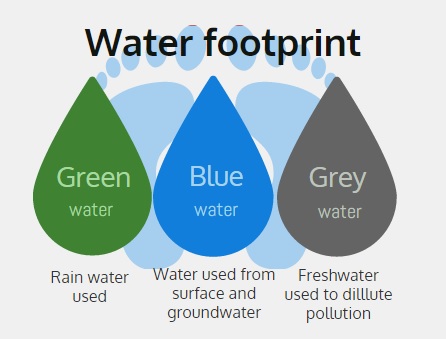 A more in-depth analysis of water use is a water footprint, which looks at both direct and indirect
water use by a consumer or producer [22]. It also includes the amount of water polluted from an activity and categorizes the types of water used into different groups (blue, green, and grey).
Water footprints between production systems and countries can vary considerably [23]. When integrating all the components of a water footprint, agriculture contributes to 92 per cent of the global freshwater footprint, of which 29 per cent is used for animal production [24]. Only four per cent of the water footprint of humanity relates to water use at home [23]. The main component of the water footprint of animal products is the water used to produce feed, which can make up around 98 per cent of the total [23]. This explains why Gerbens-Leenes and others found that feed-lot beef had a larger water footprint than pork, which was larger than poultry, but for grazed systems, beef’s water footprint was smaller than that of pork and poultry [24]. It is important to distinguish between the different types of water used – some water falls straight on the land as rain and other types are abstracted from groundwater or rivers and lakes, thus having different implications on freshwater impacts.
Meat vs. plant foods
When comparing water footprints of animal products with crops of equivalent nutritional value, crops are clearly more conservative with their water usage [21]. Looking at different production systems in different countries, Mekonnen and Hoekstra found that per calorie, the average water footprint of beef is 20 times larger than for cereals and starchy roots [21]. Per gram of protein, milk, eggs, and chicken had a water footprint 1.5 times larger than pulses. Another study showed that animal protein requires approximately 100 times more water than an equivalent portion of vegetable protein [25].
Ercin and others found that water footprints for soy products were 3.5 (soy milk) to 15 (soy burger) times lower than equivalent sized beef and cow milk products [22]. Water footprints for New Zealand dairy milk are comparable to the global average – 945 and 1084 litres per kg of milk for Waikato and Canterbury farm systems respectively, however, the environmental implications vary between Waikato and Canterbury farms as Canterbury dairy farming is heavily reliant on irrigation [26].

Figure 5: Average water footprints for 1 litre of soy milk and a 150g soy burger and equivalent animal products [22].
Water required to produce crops ranges from 500 to 2000 litres of water per kg of yield produced, far less than water required for animal products (Figure 6) [19] [25]. Beef turns out to be the most intensive food source; up to 200,000 litres of water is required to produce 1 kg of rangeland beef [19].
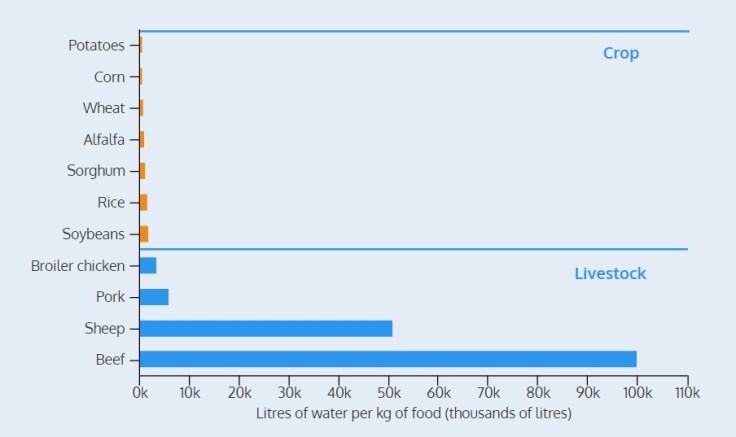
Figure 6: The estimated amount of water required for crop and livestock production [19] [25].
It appears that not only is beef hugely inefficient in water use per kg of meat, but it is also the least efficient animal product for water used per kg of protein. Compared to other animal protein sources, crickets use the least water for their protein content (Figure 7). Crickets require just 2 square feet of pasture compared to beef’s 200 square feet [27]. Furthermore, they emit zero greenhouse gases.

Figure 7: Differences between litres of water required for the production of one kg of protein [27].
 In 2015, in light of the California drought, a campaign launched (Skip Showers for Beef) highlighting the immense amount of water used for beef production compared to showers. The campaign estimated that the amount of water required for 14 hamburgers or around three steaks is equivalent to about a year of showers (using the average amount of water used per shower for one shower per day). Individuals can save more water by giving up half a kg of beef than by not showering for six months [28].
Moving to a vegetarian diet can reduce an individual’s food related water footprint by 36 per cent [23]. Although valuations can vary substantially, one study has estimated that meat based diets in industrialised countries use 3600 litres of water per day, 1.6 times more than vegetarian diets (2300 litres). Based on these calculations, a vegan diet would use 1700 litres of water. Other estimates report footprints over 15,000 litres of water a day for a meat eater, 4,500 for a vegetarian, and 1,135 for a vegan [12]. Differences may exist in calculations depending on what type of meat is consumed and where it is produced, as well as how water use is calculated. Regardless, it is clear that vegan diets use significantly less water.

Figure 8: Food related litres of water use per day for a omnivore , vegetarian, and vegan diet [23].
References:
[1] Piazza J., Ruby M.B., Loughnan S., Luong M., Kulik J., Watkins H.M. and Seigerman M. (2015). Rationalizing meat consumption. The 4Ns. Appetite, 91, 114-128
[2] Smil V. (2014). Eating meat: Constants and changes. Global Food Security, 3, 2, 67-71 http://dx.doi.org/10.1016/j.gfs.2014.06.001
[3] Food and Agriculture Organisation of the United Nations Statistics Division 2014. Retrieved 23 February 2016 from FAO Stat.
[4] ChartsBin statistics collector team (2013). Current worldwide annual meat consumption per capita. Viewed 29 February 2016 from ChartsBin.
[5] Herrero M., Havlíkb P., Valinc H., Notenbaertb A., Rufinob M.C., Thorntond P.K., Blümmelb M., Weissc F., Graceb D. and Obersteinerc, M. (2013). Biomass use, production, feed efficiencies, and greenhouse gas emissions from global livestock systems. PNAS, 110, 52.
[6] Steinfeld H., Gerber P., Wassenaar T., Castel V., Rosales M. and de Haan, C. (2006). Livestock’s long shadow: Environmental issues and options. Food and Agriculture Organisation of the United Nations. Rome, Italy. Retrieved from FAO.
[7] Eshel G., Shepon A., Makow T. and Milo R. (2014). Land, irrigation water, greenhouse gas, and reactive nitrogen burdens of meat, eggs, and dairy production in the United States. PNAS, 111, 33, 11996-12001.
[8] Ministry for the Environment and Statistics New Zealand (2015). New Zealand’s Environmental Reporting Series: Environment Aotearoa 2015. Available from Ministry for the Environment and Statistics NZ.
[9] Penning de vries F.W.T., Keulen H.V., Rabbinge R. and Luyten J.C. (1995). Biophysical limits to global food production. International Food Policy Research Institute 2020 Brief.
[10] Worldwatch Institute (2004). Meat. Now, it’s not personal! But like it or not, meat-eating is becoming a problem for everyone on the planet. World Watch magazine. Retrieved from Worldwatch Institute.
[11] Myers A. and Worm B. (2003). Rapid worldwide depletion of predatory fish communities. Nature, 423, 280-283, doi:10.1038/nature01610
[12] One Green Planet (2012). Facts on animal farming and the environment. Retrieved from One Green Planet.
[13] National Soybean Research Laboratory NSRL. Benefits of soy. Retrieved from: NSRL.
[14] Ash, M.; Livezey, J. and Dohlman, E. (2006). Soybean backgrounder. USDA: Economic Research Service. Retrieved from United States Department of Agriculture.
[15] Good K. (2014). The surprising way your diet can fix the soy and deforestation problem. One Green Planet. Retrieved from One Green Planet.
[16] Karstensen J., Peters G.P., and Andrew R.M. (2013). Attribution of CO2 emissions from Brazilian deforestation to consumers between 1990 and 2010. Environmental Research Letters, 8.
[17] WWF (2014). The growth of soy: Impacts and solutions. WWF International. Gland, Switzerland.
[18] WWF (n.d). Soy – Facts and Data. Retrieved from WWF.
[19] Pimentel D., Berger B., Filiberto D., Newton M., Wolfe B., Karabinakis E., Clark S., Poon E., Abbett E. and Nandagopal S. (2004). Water resources: Agricultural and environmental issues. BioScience, 54, 10, 909-918.
[20] Hoekstra and Chapagain, 2008, cited in Ercin A.E., Aldaya M.M. and Hoekstra A.Y. (2012). The water footprint of soy milk and soy burger and equivalent animal products. Ecological Indicators, 18, 392-402.
[21] Mekonnen M.M. and Hoekstra A.Y. (2012). A global assessment of the water footprint of farm animal products. Ecosystems, 15, 401-415. DOI: 10.1007/s10021-011-9517-8
[22] Ercin A.E., Aldaya M.M. and Hoekstra A.Y. (2012). The water footprint of soy milk and soy burger and equivalent animal products. Ecological Indicators, 18, 392-402.
[23] Hoekstra A.Y. (2012). The hidden water resource use behind meat and dairy. Animal Frontiers, 2, 2.
[24] Gerbens-Leenes P.W., Mekonnen M.M. and Hoekstra A.Y. (2013). The water footprint of poultry, pork and beef: A comparative study in different countries and production systems. Water Resources and Industry, 1-2, 25-36.
[25] Pimentel D., Houser J., Preiss E., White O., Fang H., Mesnick L., Barsky T., Tariche S., Schreck J. and Alpert S. (1997). Water resources: Agriculture, the environment, and society. BioScience, 47, 2, 97-106.
[26] Zonderland-Thomassen M.A. and Ledgard S.F. (2012). Water footprinting – A comparison of methods using New Zealand dairy farming as a case study. Agricultural Systems, 110, 30-40.
[27] Ziegler L. (2015). Keep showering, California. Just lay off the burgers & nuts. Medium. Retrieved from : Medium
[28] World Watch Institute (2004). Meat. Now, it’s not personal! But like it or not, meant-eating is becoming a problem for everyone on the planet. World Watch Magazine, 17, 4. Retrieved from World Watch
