Reality: Dams cause substantial environmental impacts, especially if supporting increased irrigation.
After the Government announced spending a further $1.6 million on water storage schemes for irrigation, there was debate coming in from all sides. Bans on new irrigation schemes were called for and responded with rhetoric that ‘dams are good for the environment’, a myth that has been flowing around for some time with no credible evidence. In fact, scientific evidence suggests the contrary.
Dams have been used for some time for purposes such as water storage, power generation, water supply, flood control, and water diversion. These uses can be hugely beneficial for human use but all will have environmental impacts, some small and some extremely damaging depending on the scale of the dam. These impacts should be considered along with the benefits when assessing the validity of dam projects. However, often these schemes are pushed ahead using mythical justifications of environmental and economic gains. Available information needs to be sound and reliable so we can make responsible, informed decisions.
These dam myths will be busted here.
In this first part we will discuss the common myths surrounding environmental benefits. In additional segments we will discuss other environmental impacts associated with dams and myths of economic benefits.
Myth 1: Dams have environmental benefits
For some time pro-irrigators have been spouting the line ‘dams are good for the environment’, often with no or poor evidence and explanation. These claims are not made by ecologists or scientists, who are among those most qualified to comment on this aspect, but often by irrigation lobbyists and farming groups. The main reason that Irrigation New Zealand chief executive Andrew Curtis doesn’t want a ban on irrigation is that he claims “quite a lot of the environmental issues will be resolved [by new water storage schemes]” [1]. Comments such as these are often made with no credible evidence, with the intention to be believed without question by the media and the public.
Dams can provide flushing flows
In the absence of natural flows in a dammed river, water storage schemes can release water in times of low flows. It is argued these releases will ‘flush’ algae out to sea and provide some dilution to pollutants such as nutrients, thereby helping improve water quality concerns from intensive farming [1]. There are many issues with the ‘flushing flow’ argument.
Natural flows are removed
During natural flood events, increases in water velocity strip off algae and wash it out to sea. The whole river system, including the tributaries, fills up with water so there is a tremendous amount of power behind these flood events. Releasing water from a single point coming out of a dam does not have the same amount of power; there is some flushing effect in the immediate vicinity of the dam, but very quickly energy is dissipated for even large amounts of water going down the river when it is not supported by all the tributary flows. Research shows that flushing flows can last for 5 to 10 kilometres downstream [2] but are often not of adequate power to ameliorate adverse effects to river ecosystems [3].
In many cases the management of flows from a dam only incorporates a minimum flow. However, freshwater scientists reveal that the most important ecological condition in river ecosystems is the maintenance of a naturally variable flow regime [4, 5, 6]. A review of 165 scientific papers revealed that 92 per cent of them reported a decrease of ecological measures in response to flow alteration [7], meaning changing natural flows was detrimental for aquatic ecosystems. The adoption of only a minimum flow regime will not protect the ecosystem health of streams as ecological communities also require floods and other flow variations to maintain their integrity [4, 6]. Although some varied provisions of flows are being integrated into some plans, it is questionable whether dams can provide flood flows that are of adequate duration and magnitude to maintain healthy ecosystems.
To set environmental flows, water managers must know how much water can be removed before there are significant detrimental effects on freshwater biodiversity [8]. Prolonged low flows can result in changes in aquatic invertebrates to ones that are suited to low velocity, high periphyton conditions, whilst taxa that prefer higher flow conditions can be greatly impacted [8]. Reduced flow alters velocity, temperature, depth, and fine sediment accumulation, which can have detrimental effects on aquatic species [9], as well as humans. The build-up of sediment and algae in rivers, exacerbated by low flows, is unpleasant and can be unsafe for human use.
Another point to consider is that councils may be required to buy water from the storage schemes to allow flushing flows, so ratepayers will be paying to deal with environmental burdens. For example, the Hawke’s Bay Regional Council agreed to pay $43 million for water to allow flushing flows from its own dam over 35 years [2]. What happens when councils decide this is uneconomic, or unnecessary from their point of view? It is questionable in times of drought and water shortages whether releasing water downstream to augment low flows will be upheld. There is some acceptance that enough water should be left in our rivers and streams to maintain healthy aquatic ecosystems, but there is disconnect between how much water scientists say is enough for this purpose, how much policy makers allocate, and how much is actually left. Until scientifically based environmental flows are incorporated and implemented in management plans, we cannot trust that a managers idea of minimum flow regimes will do anything to protect ecosystem health.
Will dams reduce nutrient concentrations in rivers?
Managing nutrient problems with the mantra that the ‘solution to pollution is dilution’ is a very basic and outdated view of dealing with pollution problems. This management practice may have been acceptable with organic waste and very small populations but it does not work with large populations and the various toxic contaminants that are widespread in today’s society. It is now well accepted among scientists that dilution is not an adequate solution for managing contaminants.
Even at small concentrations, nutrients can cause harm in ecosystems. Furthermore, without powerful flows to flush nutrients downstream, nutrients (particularly phosphorus) will accumulate in deposited sediment on the beds of streams and rivers, causing adverse effects in the area.
Conversely, dams will not only fail at alleviating nitrate problems, but they will most likely make them worse through the increased intensification that will occur. Consequently, even more water would be required to dilute the increasing concentrations of nutrients being discharged to freshwater.
Dams allow stored water to recharge groundwater
Another similar environmental justification for building dams suggests we can use stored water to recharge groundwater aquifers [1]. Many of our groundwater resources are depleted from over-extraction, often for irrigation, and restoring aquifers is beneficial for helping stream flows. However, whether the stored water would be used for groundwater recharge once the dam is built is another concern we need to consider. There may be initial intentions of this happening but when water shortages and drought start to occur, irrigation may become a priority.
Importantly, water for groundwater recharge does not have to be obtained from stored dam water; we can be using treated wastewater, storm water, and agricultural runoff, instead of treating them as wastes to dispose of [10]. This option is far cheaper than building a dam. Wetlands can also help maintain water table levels and provide recharge for groundwater, not to mention the multitude of other ecosystem services they provide.

Figure 1: Natural and artificial sources of groundwater recharge. Image source: USGS
Mitigation against drought and climate change
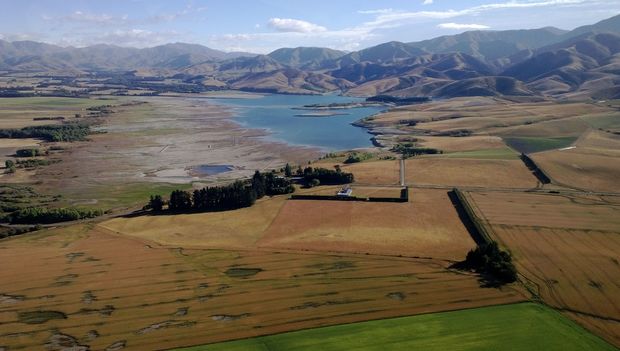
There is dispute that water storage is necessary to address climate change issues by supplementing river flows or recharging aquifers [11]. Without a dam and storing water, it is said that some rivers run dry in dry periods [12]. On the contrary, dry rivers are a likely result of abstracting too much water, and dams will only amplify this issue, not alleviate it. We have already discussed above that maintaining just a minimum flow won’t improve ecological conditions and flushing flows provided by most dams will not be adequate to ameliorate environmental impacts.
Abstracting large amounts of water from rivers and aquifers for irrigation and other uses is how many rivers end up dry and toxic in summer. Arguments to mitigate climate change using dams justify trying to mend a problem with the same mechanism that caused it.
Furthermore, changing farming practices to become even more dependent on water usage is irresponsible and foolish when dryer conditions are predicted under climate change [13]. We should be investing in farming solutions that are drought resistant and adaptable to a regions changing climate.
Water abstraction in New Zealand
New Zealand was the fourth highest abstracter of water per capita among Organisation for Economic Co-ordination and Development (OECD) countries in 2010 [14] and equates to two to three times more than most other OECD countries [15]. New Zealand’s water usage has been increasing in the last few decades, particularly in response to increased use for irrigation to enable dairy intensification.

Consumptive allocated water use in New Zealand totals 757 million cubic metres per week (Mm3/week), sufficient to fill 30 Olympic-sized swimming pools every minute. Annually this totals 27 billion cubic metres (Bm3/year), equivalent to about 46 per cent of the volume of Lake Taupō [16]. However, this water use is uneven; some areas are extremely water stressed and over allocated, while others are better.
Excluding hydro, irrigation uses 78 per cent of the weekly consumptive allocation of freshwater in New Zealand (Figure 2) or about half if including hydro (one hydro dam uses 40% of allocated water and discharges out to sea) [16]. Canterbury is a particularly heavy water consumer, using 60 per cent of the national water allocated for irrigation annually. A staggering 90 per cent of Canterbury’s allocated water was used for irrigation, mainly for pasture [16].
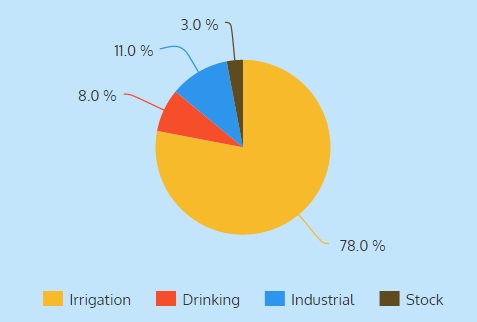
Figure 2: Distribution of New Zealand’s weekly consumptive water allocation excluding hydro generation [16].
By taking more water away from rivers through water storage schemes, we are amplifying drought conditions and low flow issues.
Irrigation increases intensification
The ecological effects of increased irrigation should also be considered when weighing up the impacts of water storage projects. Irrigation directly allows more intensive agricultural land uses and there is a direct link between irrigation and increased adverse effects on water bodies [17]. We have been told that these water storage projects are not all about dairy, but dairy farming is the single biggest use for the captured water in most of these schemes, replacing less intensive land uses.
From 1999 to 2010, the consented irrigated area increased from 600,000 hectares (ha) to over 1 million ha, with 63 per cent of the land in Canterbury [16]. However, these totals vary from estimations of the total area equipped for irrigation – of which half was in dairy farming (equal to 352,414 ha) [18]. It is unclear how much of total land is actually irrigated as there appears to be little monitoring on water or land usage for irrigation in New Zealand.
A 45 per cent increase in farming is planned for the Canterbury region, bringing in an extra 200,000 ha of farmland [19], the majority of which will be supported by irrigation. The Central Plains Water (CPW) scheme in Canterbury plans to increase irrigated land by 60,000 ha [20], half of which is likely to be converted to dairy [19]. Likewise, 45 per cent of the projected irrigated land use under the Wairarapa Water Users Project (WWUP) is expected to be in dairy, alongside 36 per cent in dairy or dairy support in the Ruataniwha scheme [21]. Dairying plays a major part in these schemes and will put increasing pressure on our land and waterways.
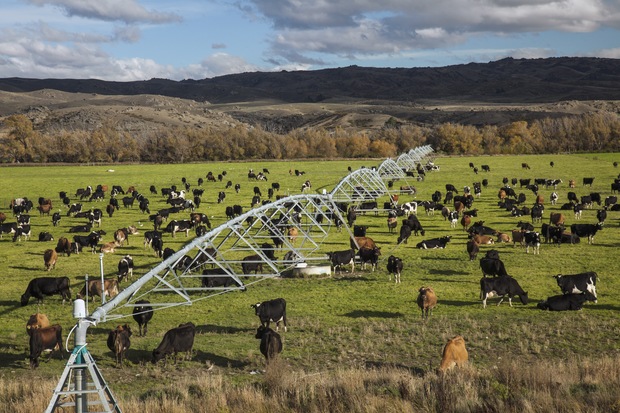
 For instance, an increase of 30,000 ha in dairy land proposed under the CPW scheme will put at least 105,000 extra cows on the land (based on average stocking rates in the region [22]). This many cows will produce solid waste equal to 1.47 million people and as much faecal bacteria produced by 3.5 million people*. That’s a heap of extra waste to deal with, and a huge risk to public health.
New Zealand has the highest per-capita frequency of water borne diseases in the OECD countries [15]. Rates of enteric diseases, such as campylobacter, are higher in areas with more intensive animal farming [17]. With an increase in one type of animal comes an increase in bugs such as E. coli, Campylobacter, Salmonella, Cryptosporidium and Giardia [2, 23]. Nationally, 62 per cent of New Zealand’s rivers are unsafe to swim in due to pathogen contamination [46].

The Canterbury District Health Board reported an increase in gastro-intestinal issues , particularly in Ashburton [2, 23] (where there is a high incidence of dairy farming). Likewise, the risk of Campylobacter notifications in Canterbury was higher in regions with dairying and major irrigation schemes than areas with dairying but without major irrigation, suggesting that irrigation contributed to the disease burden [24]. Corresponding with this, increasing contamination of faecal bacterial has been reported in lowland Canterbury waterways [17]. A health impact assessment undertaken for the CPW scheme found that the potential health risks outweighed the probable financial benefits to a few people [25].

On top of bacterial issues from intensification, irrigation is likely to increase nutrient levels in freshwater. Already, elevated nitrate levels are found in groundwater, lakes, and rivers draining pastoral land [26, 27, 28], particularly in catchments predominantly in dairy farming [29, 30]. Irrigated farms leach more nutrients than non-irrigated due to the increased intensification and higher cow numbers they allow [30, 31, 32, 33, 34], along with more water to flush nutrients through the soil to groundwater. Dairy intensification can increase nutrient leaching rates by 100 per cent [35].

Irrigated farms are unlikely to leach less than 30 kg of nitrogen per hectare per year (N/ha/yr) [21] and are most likely over 100 kg N/ha/yr [33, 36]. Leaching of 180 kg N/ha/yr was estimated in Canterbury [36]. Going by conservative estimates (of 30 kg N/ha/ya), the CPW scheme alone will discharge an extra 900 tonnes of nitrogen into Canterbury’s groundwater, lakes, and rivers every year. The block of land for the CPW scheme between the Rakaia and Waimakariri rivers already exceeds the nutrient pollution limits as part of the Canterbury Water Management Strategy (CWMS) [19]. With a region already dealing with increasing nitrogen and water stress problems, it seems crazy to exacerbate this problem even further. But this scheme has already received consent, so there is no stopping it.
Similarly, there are already problems in Lake Wairarapa; it is classed as supertrophic [37], meaning it is very high in nutrients and of poor water quality. Work with landowners to improve water quality around Lake Wairarapa is likely to be undone with plans to further intensify in the upper catchment [38].
New Zealand has a two contrasting scenarios in lake water quality. Nationally, some of our lakes are among the most nutrient enriched in the world. The Waikato lakes have nutrient concentrations 34 times higher than before human intervention [19]. Conversely, in the highlands we still have pristine lakes, but that’s mainly because they’ve been in areas too difficult to farm or develop so we’ve largely left them alone.

In some cases, the problem lies with limit setting. For example, agreed nitrate limits for the Hurunui catchment in North Canterbury became diluted through the process. Scientists advised that the nitrate level should not go past the current load of 693 tonnes per year, as agreed in a draft zone committee recommendation. Environment Canterbury (ECAN) commissioners then raised the load to 832 tonnes and again after a RMA hearing process it was raised again to 963 tonnes [19].
The same can be seen in the National Policy Statement (NPS) for Freshwater, which sets national standards for freshwater quality. Measuring rivers against gross toxicity levels rather than ecosystem health levels has portrayed the state of freshwater as relatively good. Under the NPS, nitrate limits have been set at 6.9 mg/litre, which is the level at which 20 per cent of fish die from poisoning. However, algal mats start to bloom at much lower levels of 0.4 mg/litre (Figure 3). These algal mats cause highly fluctuating dissolved oxygen levels in water, which then kill off fish. The fish will be long gone before nitrate gets to levels of 6.9 mg/litre. The response from irrigators is that soupy green waterways that kill our wildlife are not directly harming people, so there is no need to worry [19].

Figure 3: The image on the left shows an algal bloom in a river. The black spots on the rocks in the image on the right is cyanobacteria, also known as blue-green algae, which can become toxic.
Yet, it may not be too long until nitrogen in water does start to harm people. The Canterbury Health Board advises against using water in some intensely farming catchments for the use of feeding young bottle fed babies and pregnant women because it can cause issues such as blue baby syndrome. Groundwater testing in Canterbury in 2014 revealed that almost eight per cent of tested wells exceeded the Ministry of Health drinking water guidelines for nitrate with over half of these in Ashburton [39], an area with a high predominance of dairy farming. Other effects of high nitrate levels are the growth of toxic algae, such as cyanobacteria (Figure 3). This has already killed several dogs drinking from rivers earlier this year [40, 41, 42, 43, 44], and if the problem persists, it will only be a matter of time before a child unknowingly plays in toxic water and dies.

More water storage projects will only exacerbate current water quality problems by incentivising more agricultural intensification. Health warning signs may become increasingly common around our waterways if irrigation increases. Resilient agricultural systems that are not dependent on increasing inputs are needed for New Zealand’s future.
In addition to the supposed ‘environmental benefits’ of dams, which turn out to be losses, there are other obvious effects caused by dams not mentioned by the proposers when they harp on about benefits. These will be discussed in additional segments.
*One dairy cow produces waste equivalent to at least 14 people, as much coliform bacteria as 33 people and nitrogen comparable to 25 people [29, 45].
References:
[1] Cronshaw, T. (2016). Irrigators ashast at tourism call for five year ban on new irrigation. NZ Farmer. Retrieved from: here.
[2] Radio New Zealand. (2016). How environmently friendly are irrigation dams? Published 17 March, 2016 by Radio NZ.
[3] Death, R. (2013). Statement of evidence by Associated Professor Russell Death on behalf of Hawkes Bay Fish and Game, October 2013, Board of Inquiry Tukituki Catchment Proposal.
[4] Death, R. One Plan evidence by Russell Death for Fish and Game and Forest and Bird. Powerpoint presentation.
[5] Poff, N.L. et al. (2009). The ecological limits of hydrologic alteration (ELOHA): a new framework for developing regional environmental flow standards. Freshwater Biology. doi:10.1111/j.1365-2427.2009.02204.x
[6] Poff, N.L. (2009). Managing for variability to sustain freshwater ecosystems. Journal of Water Resources Planning and Management, 135, 1, 1-4.
[7] Poff, N.L. and Zimmerman, J.K.H. (2010). Ecological responses to altered flow regimes: a literature review to inform the science and management of environmental flows. Freshwater Biology, 55, 194-205. doi:10.1111/j.1365-2427.2009.02272.x
[8] James, A.B.W., Dewson, Z.S. and Death, R.G. (2008). The effect of experimental flow reductions on macroinvertebrate drift in natural and streamside channels. River Research and Applications, 24, 22-35.
[9] James, A.B.W., Dewson, Z.S. and Death, R.G. (2008). Do stream macroinvertebrates use instream refugia in response to severe short-term flow reduction in New Zealand streams? Freshwater Biology, 53, 1316-1334.
[10] Choy, J., McGhee, G. and Rohde, M. (2014). Understanding California’s Groundwater – Recharge: Groundwater’s second act. Stanford Woods Institute for the Environment. Stanford University. Retrieved from here.
[11] Rotherham, F. (2016). Irritated Irrigation NZ rejects call for five-year ban on new water schemes. National Business Review. Retrieved from NBR.
[12] Cronshaw, T. (2015). Dry threat lingers over Lake Opuha. NZ Farmer. Retrieved from here.
[13] Ministry for the Environment (2014). Climate change impacts in New Zealand. Retrieved from Ministry for the Environment.
[14] OECD (2013). Water consumption, in OECD Factbook 2013: Economic, Environmental and Social Statistics. OECD Publishing: Organisation for Economic Co-operation and Development.
[15] OECD (2007). OECD Environment Performance Reviews: New Zealand. Organisation for Economic Co-operation and Development.
[16] Rajanayaka, C., Donaggio, J. and McEwan, H. (2010). Update of water allocation data and estimate of actual water use of consented takes 2009-10 (Prepared for Ministry for the Environment No. H10002/3). Aqualinc.
[17] Green, J. (2014). Public health implications of land use change and agricultural intensification with respect to the Canterbury Plains: A literature review. Christchurch: Canterbury District Health Board. Retrieved from Canterbury District Health Board.
[18] Statistics New Zealand (2013) 2012 Agricultural census tables. Retrieved 4 October 2013, from Statistics New Zealand.
[19] McCrone, J. (2015). NZ irrigation and its guilty secrets. Retrieved from here.
[20] Central Plains Water scheme. About Us. Retrieved 1 April 2016 from here.
[21] Ropere Consulting. (2016). Those damn dams are all about Dairying, Prime Minister. Press Released on 15 March, 2016 retrieved from here.
[22] Livestock Improvement Corporation and DairyNZ (2015). New Zealand Dairy Statistics 2014-15. Retrieved from DairyNZ.
[23] Deavoll, P. (2016). Canterbury rumbly-gut outbreak linked to dairying. Retrieved from here.
[24] Close, M., Dann, R., Pirie, R., Savill, M. and Smith, Z. (2008). Microbial groundwater quality and its health implications for a border-strip irrigated dairy farm catchment, South Island, New Zealand. Journal of Water and Health, 6, 1, 83-98.
[25] Humphrey, A., Walker, M. and Porteus, A. (2008). Health impact assessment of Central Plains Water Scheme. Christchruch: Canterbury District Health Board.
[26] Ballantine, D., Brooker, D., Unwin, M. and Snelder, T. (2010). Analysis of national river water quality data for the period 1998-2007 (Prepared for Ministry for the Environment). Christchurch, New Zealand: NIWA.
[27] Larned, S., Scarsbrook, M., Snelder, T., Norton, N. and Biggs, B. (2004). Water quality in low elevation streams and rivers of New Zealand: Recent state and trends in contrasting land cover classes. New Zealand Journal of Marine and Freshwater Research, 38, 2, 347-366.
[28] Ministry for the Environment (2015). Environment Aotearoa 2015. Wellington, New Zealand: Ministry for the Environment. Retrieved from MfE.
[29] Environment Waikato (2008). The condition or rural water and soil in the Waikato region: Risks and opportunities. Hamilton, New Zealand. Environment Waikato.
[30] Parliamentary Commissioner for the Environment. (2004). Growing for good: Intensive farming, sustainability and New Zealand’s environment. Wellington, New Zealand: Parliamentary Commissioner for the Environment.
[31] Ford, R., & Taylor, K. (2006). Managing nitrate leaching to groundwater: An emerging issue for Canterbury. Water Rights Trust.
[32] Green, S. R., Manderson, A., Clothier, B. E., Mackay, A. D., & Benson, M. (2012). Catchment-wide modelling of land-use impacts on the Ruataniwha Plains. Paper presented at the 25th Annual FLRC Workshop: Advanced Nutrient Management: Gains from the Past – Goals for the Future, Massey University, Palmerston North, New Zealand. List of papers.
[33] Ministry for the Environment (2001). Managing waterways on farms: A guide to sustainable water and riparian management in rural New Zealand. Wellington, New Zealand: Ministry for the Environment.
[34] Monaghan, R. M., Carey, P. L., Wilcock, R. J., Drewry, J. J., Houlbrooke, D. J., Quinn, J. M., & Thorrold, B. S. (2009). Linkages between land management activities and stream water quality in a border dyke-irrigated pastoral catchment. Agriculture, Ecosystems & Environment, 129(1-3), 201-211.
[35] Power, I., Ledgard, S., & Monaghan, R. (2002). Nutrient budgets for three mixed farming catchments in New Zealand. Wellington, New Zealand: Ministry for Agriculture and Forestry.
[36] Lilburne, L., Webb, T., Ford, R., & Bidwell, V. (2010). Estimating nitrate-nitrogen leaching rates under rural land uses in Canterbury. Christchurch, New Zealand: Environment Canterbury Regional Council.
[37] Perrie, A. and Milne, J.R. (2012). Lake water quality and ecology in the Wellington region. Great Wellington Regional Council, Wellington.
[38] Ford, G. (2016). Wairarapa dam grant irks critics. Posted in the Wairarapa Times-Age on 14 March, 2016.
[39] Environment Canterbury (2014). Annual Groundwater Quality Survey 2014: Groundwater science section. Environment Canterbury Regional Council.
[40] Hawkes Bay Regional Council (2016). Cyanobacteria suspected cause of dog death. Posted 11 January, 2016 by Hawkes Bay Regional Council.
[41] Victoria University (2015). Hidden danger in our rivers. Posted 16 December 2015 by Victoria News Council.
[42] Taylor, M. (2016). Second dog death attributed to algae. Otago Daily Times, posted 19 February 2016 by Otago Daily Times.
[43] Wairarapa Times-Age (2016). Toxic algae bloom in Waipoua River. Posted 20 January 2016 by Wairarapa Times-Age.
[44] Tuckey, K. (2016). Otaki toxic algae dog death reported. The Dominion Post, Posted 4 February 2016 by The Dominion Post.
[45] Fleming, R. and Ford, M. (2001). Human versus animals – comparison of waste properties. Ridgetown College, University of Guelph.
[46] Unwin, M., and Larned, S. (2013) Statistical models, indicators and trend analyses for reporting national-scale river water quality. NIWA
